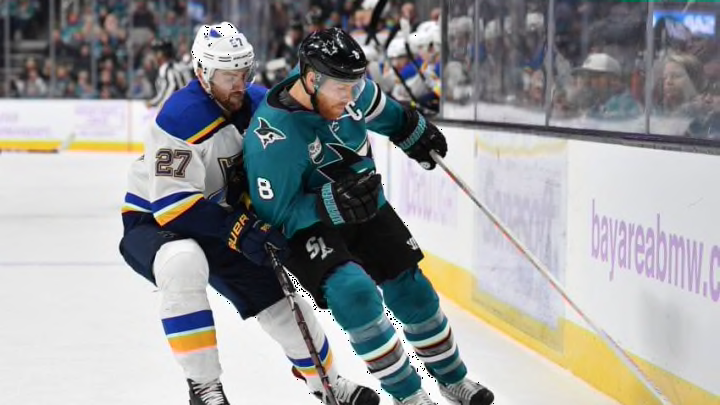
The San Jose Sharks are about a fourth of the way through their most sensationalized season in franchise history. The results on the ice have produced mixed reactions from the fan base. They’ve played quite a bit of hockey and their are still plenty of questions swirling around this teams future.
The San Jose Sharks record is currently 11 – 7 – 4 with 26 points through their first 22 games of the season. They’ve been scurrying along with some impressive victories but have failed to string together 3 wins in a row. There have also been down spells. They’ve been lethargic in some periods of play, and even some entire games.
However, all things considered, this team leads the Pacific Division and from the looks of the competition it seems like it’s the San Jose Sharks division for the taking. The other traditional West coast powerhouses are floundering, and teams like the Flames, ‘Yotes, Canucks, and Oilers remain untested in the early stages of this season. So the first seed is definitely within arms reach. The Sharks road to the Stanley cup will prove to be that much easier if it’s paved mainly through the SAP Center.
More from Blades of Teal
- San Jose Sharks fans need this Erik Karlsson shirt from BreakingT
- Norris Trophy odds show Erik Karlsson a step above the rest
- Are you the 2021 FanSided Sports Fan of the Year?
- Korenar deserves a chance at the NHL level
- Three prospects the Sharks should consider drafting
Home ice advantage isn’t the only thing that this team will need to gain some traction. A little bit of luck could go a long way for Team Teal.
The San Jose Sharks are out pacing much of the league in terms of the shot sharing metrics and expected goals for percentages. But the ice just doesn’t seem to be tilted in the this teams direction.
The San Jose Sharks have been dominating possession spending a significant amount of time in their opponents zone and are generating a sundry of shots, but are failing to light the lamp at crucial times.
Team Teal ranks in the top 5 in the league in 5v5 SF%, SCF%, and HDCF%, per naturalstattrick. For a bulk of the time on the ice the Sharks are getting the better of their opponents as far as shot generation and creating dangerous scoring chances. With underlying numbers like these you would think San Jose would be one of the highest scoring teams in the league. However this teams luck around the goal crease has hindered their ability to produce points
The San Jose Sharks rank in the bottom third in the league at 5v5 shooting percentage with 7.59 and goals for percentage at 49.54, per naturalstattrick. These statistics are puzzling considering this teams individual scoring resume. But this year their strong possession stats have only resulted into questionably underwhelming goals for output.
A substantial amount the San Jose Sharks offensive strategy has shifted in the past 8 months. This dip in production is to be expected, but history tells us that their shooting percentage should take an upward swing. During Coach Pete DeBoers tenure behind the bench the San Jose Sharks have shot around league average at an approximate 9.1% clip, per Hockey Reference. However the Sharks strong possession numbers and ability to generate quality shots on net illustrate that this team is trending in a positive direction.
On the opponents end of the ice the San Jose Sharks are excelling at sustaining pressure and getting good looks at the opposing net minder. Sadly Team Teal has not been as successful at defending their own zone. They’ve been very leaky and at times the dam bursts. Team Teal doesn’t give up a large amount of SOG, but more than a few of them end up being two on one highly dangerous scoring chances.
The two goalies on the Sharks roster have faced some dangerous scoring chances and produced varying outcomes. One of my favorite visualization tools Hockeyviz.com created a graph that charts shot rates faced by the degree of difficulty. You may notice that the two Sharks goaltenders have faced some difficult shots, but Jones has failed to make some big saves.
Updated after last night's games pic.twitter.com/g2TVcDj8s1
— Micah Blake McCurdy (@IneffectiveMath) November 18, 2018
The newly configured defensive pairings might have something to do with the spike in goals against, but most of the blame can be put on this teams extremely low save percentage. Martin Jones and Aaron Dell have bailed the team out at times their overall play has been lackluster.
The San Jose Sharks are nearly dead last in even strength save percentage at 89.36%, per naturalstattrick, but have fared well on the penalty kill like the rest of the team. Regardless the goal keeping for this team has costs them games.
Traditionally a low save percentage is something that doesn’t plague a net minder all season, especially one who’s been solid for about 3 years straight. The Sharks also have the luxury of having a backup who would start on a nightly basis for some teams in the league. So expect the goal keeping to stabilize with more opportunities to see the new defense play in front of them
The main takeaway from the first quarter portion of the season is that this team has relatively unlucky. Considering the amount of offensive zone pressure and shots they’ve been generating during the first 22 games the San Jose Sharks should be scoring at a much higher rate. Expect Team Teal to start converting all these shots into goals, and get some stops from their net minders.
